Classification Tree Model
Document
Information
Package base
version 2.7.1
11/6/2008
Project 5: Statistical
Learning with Multi-Scale Cardiovascular Data
Contact email: yqin@jhu.edu
1.1. Introduction to
Classification Trees
2. Instruction for the tree.revised() Function
1.1. Introduction to Classification Trees
In general, a
decision tree is a predictive model, meaning a mapping from data observations
to an estimate of some dependent variable of interest.
In a
classification tree, the dependent variable Y is discrete, often binary
indicating one of two phenotypes.
Each node in the tree corresponds to one of the predictive variables or
features; the branches emanating from that node correspond to the possible
values taken by that feature. In
many cases, the feature is quantized to only two values corresponding to
comparison to a threshold. Each
leaf of the tree is labeled by one of the values assumed by Y. In this way, Y is predicted by the leaf
at the end of the unique path down the tree determined by the data. Each such path, or branch, is then a
conjunction of events determined by the features along the branch. From here on
we consider only the case of a binary dependent variable and binary splits
corresponding to applying a threshold to a feature.
Each split in the
tree can be seen as dividing the feature space into two groups. A good split is one for which the two
children as "pure" as possible in terms of the dependent variable
Y. Ideally, Y would be entirely
determined, but such splits are rarely available in practice and one chooses
the split (i.e., the feature and the threshold) which most reduces the
uncertainty about Y. The splitting
process is terminated when the purity reaches a certain predetermined level.
This process of recursively choosing features which provide good splits can be
seen as a way of selecting discriminating features for predicting Y. The entire process is sometimes called
recursive partitioning because at each level of the tree we obtain a partition
of the feature space. The final
classification is based on the final partition.
Now, let's look
at an example. Suppose X1, X2, X3, X4 and X5 are independent variables which
are used to predict Y, a binary dependent variable.
First, the model
tries to find the best variable X among X1 to X5 and critical value or
threshold A, so that when dividing the whole dataset to two groups based on the
criterion X>=A or X<A, the average purities of the two groups is the
highest possible. Suppose X1 is
this variable with threshold A. Then the current tree is simply ( > stands
for greater than or equal)
Now repeat the
procedure for each subset (node) until every subset reaches a certain
pre-specified purity in terms of the two classes represented by Y. In this way,
we obtain a list of variables which we use for partitioning divide the dataset.
We also have a series of critical values (A, B, C��) which correspond to each split.
In the end we have diagram like this:
X1>A X1<A Root, the
whole dataset X2>C X1<B X1>B X2<C X4>E X2<D X2>D X4<E X5<F X5>F Leaf 1 Leaf 7 Leaf 6 Leaf 5 Leaf 4 Leaf 3 Leaf 2 Leaf 8 X5<G X5>G![]()
![]()
![]()
![]()
![]()
![]()
![]()
![]()
![]()
![]()
![]()
![]()
![]()
![]()
![]()
![]()
![]()
![]()
![]()
![]()
![]()
![]()
![]()
![]()
![]()
![]()
![]()
![]()
![]()
At each node,
including the terminal ones, we have an estimate of the posterior distributions
of Y given the series of conditions (e.g. X1<A, X2>C and so on) leading
to that node. So we can estimate Y
based on X1 to X5.
Note that not all
the variables are generally used in the tree. In fact, in many cases, only a small fraction of the
variables appear in the tree. The program selects the best variables to split
the dataset. For example, in the
diagram above, X3 is not used anywhere in the analysis.
1.2
Comparison Indicator
Besides the
ordinary classification tree analysis based on thresholding individual
features, we also want to take comparison between features into consideration.
For example, we may want to base a split on the criterion X1>=X2 or
X1<X2. To allow for such questions in the tree, we can generate a indicator
variable Ind1, such that Ind1=-1 when X1<=X2 and ind1=+1 otherwise. So the
variable list becomes X1...X5 and Ind1. We do the tree classification analysis
again with original variables and new indicators. When an indicator is used in
the model, it means the new criterion based on comparing two variables is
applied to split the dataset.
2.
Instruction for the tree.revised() Function
The code in the
end of this article creates a function dedicated to this tree analysis. The
function only requires you to input the dataset's name and make sure each
column of this dataset has a name.
Once the name of
the dataset name is provided, the function will guide you through the procedure
of selecting the dependent variable, independent variables and comparison
variables (the ones you want to compare between).
Now let's look at
an example.
data(cpus,
package="MASS")
tree.revised(iris)
In the iris
dataset, there are 5 columns, namely, "Sepal Length", "Sepal
Width", "Petal Length", "Petal Width",
"Species"
Once hit
"enter", the function will generate three windows look like below.
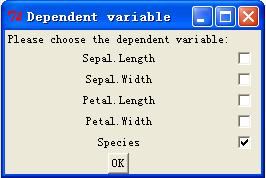
Now choose the
variables by checking the boxes next to them.
For dependent
variables, just choose one, which has to be factor format or numeric.
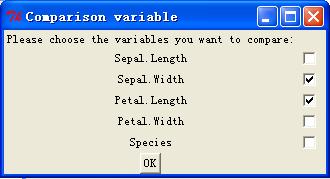
For the
comparison variables, once you check some variables, all these variables will
be compared in all possible pairs. So if you select n variables for comparison,
you will have n(n-1) indicators (i.e. n(n-1) comparisons). Each indicator
equals �C1 if, in the pair, the one appears in the top is smaller than the one
appears in the bottom, and equals +1 otherwise.
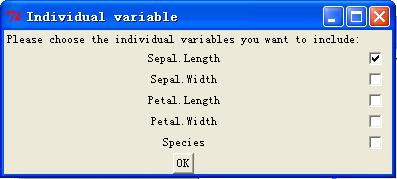
For the
independent variables, it doesn't have to include all the comparison variables.
There can be some variables that are included in comparison but not in
individual variables list.
Once the
selection is done, hit "OK". The program will confirm your selection
if it is complete; otherwise it will remind you which part is missing. If
everything is fine, then the output is displayed in the R console window.
node), split, n, deviance, yval, (yprob)
* denotes terminal node
1) root 150
329.60 setosa ( 0.3333 0.3333 0.3333 )
2)
Sepal.Width_Petal.Length < 0 100 138.60 versicolor ( 0.0000 0.5000 0.5000
)
4) Sepal.Length < 6.15 45 50.05 versicolor ( 0.0000 0.7556 0.2444
)
8) Sepal.Length < 5.75 24 18.08 versicolor ( 0.0000 0.8750 0.1250 ) *
9) Sepal.Length > 5.75 21 27.91 versicolor ( 0.0000 0.6190 0.3810 ) *
5) Sepal.Length > 6.15 55 66.33 virginica ( 0.0000 0.2909 0.7091
)
10) Sepal.Length < 7.05 43 56.77 virginica ( 0.0000 0.3721 0.6279 ) *
11) Sepal.Length > 7.05 12 0.00 virginica ( 0.0000 0.0000 1.0000
) *
3)
Sepal.Width_Petal.Length > 0 50 0.00 setosa ( 1.0000 0.0000
0.0000 ) *
In the output,
"Sepal.Width_Petal.Length" is an indicator whose name contains two
comparison variables names and connects them with a "_". The numbers
in the parentheses are the posterior distribution of Y, which is Species in
this case. The asterisk in the end indicates that this is a leaf.
So in this case,
the diagram looks like this:
3. R Code
3.1 Commented Code (download here)
rm(list=ls())
tree.revised<-function(d)
{
library(tree)
require(tcltk)
###############################
# dependent
variable
################################
# 0. choose
dependent variable
################################
# 0.1 create
dependent variable list
CV.list_dep <-
c()
CV.name.list_dep
<- c()
# List all the
variables in data.frame d, and record their names column numbers.
# Store them to
CV.list_dep and CV.name.list_dep.
for (i in
seq(1,dim(d)[2]))
{
CV.list_dep<-c(CV.list_dep,i)
CV.name.list_dep<-c(CV.name.list_dep,names(d)[i])
}
names(CV.list_dep)<-CV.name.list_dep
################################
# 0.2 create
choosing dependent variable module
# Create a tk
object level. i.e. create a window.
tt_dep <-
tktoplevel()
# Change the
title of the window to "Dependent variable".
tkwm.title(tt_dep,"Dependent
variable")
# Create a list
to store checkboxes for dependent variable selection.
cb_dep<-list()
# Assign each
variables a check box.
for (i in
1:length(CV.list_dep))
{
checkbox_dep <-
tkcheckbutton(tt_dep)
#print(i)
cb_dep[[i]] <- checkbox_dep
}
# Create a list
to store selection of dependent variable.
cbValue_dep <-
list()
# Assign
"cbValue_dep" all "0"s for intial values.
for (i in
1:length(CV.list_dep))
{
cbValue_dep[[i]] <-
tclVar("0")
}
# Associate each
checkbox with each of their selections.
for (i in
1:length(CV.list_dep))
{
#print(i)
tkconfigure(cb_dep[[i]],variable=cbValue_dep[[i]])
}
# Show the
guidence in the window.
tkgrid(tklabel(tt_dep,text="Please
choose the dependent variable:"))
# Show the
variable names and checkboxes in the window.
for (i in
1:length(CV.list_dep))
{
#print(i)
tkgrid(tklabel(tt_dep,text=CV.name.list_dep[i]),cb_dep[[i]])
}
# Create an
indicator recording whether the "OK" in the window has been clicked.
# if not clicked,
ind.OnOk_dep equals to 0. If clicked, the indicator becomes 1.
ind.OnOk_dep
<- 0
# create a
function to execute once the "OK" is clicked.
OnOK_dep <-
function()
{
# Create a vector to store the
varialbe selection.
cbVal_dep <<- c()
# Pass the value from cbValue_dep
to cbVal_dep. And force them to be numeric.
for (i in 1:length(CV.list_dep))
{
cbVal_dep[i] <<-
as.numeric(tclvalue(cbValue_dep[[i]]))
}
# Close the window.
tkdestroy(tt_dep)
# Create a vector to store the
names of the selected varialbes.
cbCharacter_dep <<-
CV.name.list_dep[cbVal_dep==1]
#print(cbVal_dep)
#print(cbCharacter_dep)
# Create a message (a string) to
confirm with user.
msg_dep="Your choices for
dependent variable is:"
# Complete the message by adding
the name of selected variable to the string
for (i in
1:length(cbCharacter_dep))
{
msg_dep=paste(msg_dep,cbCharacter_dep[i],sep=" ")
}
# Show the message by pop up a
new window.
tkmessageBox(message=msg_dep)
# Detect whether other selections
(selections for comparison variables and
# individual varialbes) have been
made. "ind.OnOk" and "ind.OnOk_indi" are
# indicators of whether the
selections for comparison and individual variables
# are completed.
# If complete, do the tree
analysis.
if ((ind.OnOk ==
0)|(ind.OnOk_indi == 0))
{
# If not
complete, pop up a reminder message
tkmessageBox(message="Please choose comparison and individual
variables")
}
else
{
# If complete,
store the column number of dependent variable to dep.var.
dep.var=(1:dim(d)[2])[cbVal_dep==1]
# Store the
column numbers of individual variables to CV.input.list.
CV.input.list=(1:dim(d)[2])[cbVal_indi==1]
# Store the
column numbers of comparison variables to comparison.CV.list.
comparison.CV.list=(1:dim(d)[2])[cbVal==1]
print(dep.var)
print(CV.input.list)
print(comparison.CV.list)
# Do the tree
analysis, and print the output.
print(tree.comparison(dep.var,CV.input.list,comparison.CV.list,d))
}
# Change the indictor for
dependent variable to 1.
ind.OnOk_dep <<- 1
}
# Create a botton
which once get clicked, the OnOK_dep will be executed.
OK.but_dep <-
tkbutton(tt_dep,text="OK",command=OnOK_dep)
# Show the botton
in the window.
tkgrid(OK.but_dep)
tkfocus(tt_dep)
################################
# 1. choose
variables to create comparison indicators
################################
# 1.1 create
comparison variable list
# Use the same
variable list for the selection of comparison variables.
CV.list<-CV.list_dep
CV.name.list<-CV.name.list_dep
################################
# 1.2 create
choosing variables module
# same as the
comments for dependent variable selection.
tt <-
tktoplevel()
tkwm.title(tt,"Comparison
variable")
cb<-list()
for (i in
1:length(CV.list))
{
checkbox <- tkcheckbutton(tt)
#print(i)
cb[[i]] <- checkbox
}
cbValue <-
list()
for (i in
1:length(CV.list))
{
cbValue[[i]] <-
tclVar("0")
}
for (i in
1:length(CV.list))
{
#print(i)
tkconfigure(cb[[i]],variable=cbValue[[i]])
}
tkgrid(tklabel(tt,text="Please
choose the variables you want to compare:"))
for (i in
1:length(CV.list))
{
#print(i)
tkgrid(tklabel(tt,text=CV.name.list[i]),cb[[i]])
}
ind.OnOk <- 0
OnOK <-
function()
{
cbVal <<- c()
for (i in 1:length(CV.list))
{
cbVal[i]
<<- as.numeric(tclvalue(cbValue[[i]]))
}
tkdestroy(tt)
cbCharacter <<-
CV.name.list[cbVal==1]
print(cbVal)
print(cbCharacter)
msg="Your choices for
comparison variables are:"
for (i in 1:length(cbCharacter))
{
msg=paste(msg,cbCharacter[i],sep=" ")
}
tkmessageBox(message=msg)
if ((ind.OnOk_dep ==
0)|(ind.OnOk_indi == 0))
{
tkmessageBox(message="Please choose dependent and individual
variables")
}
else
{
dep.var=(1:dim(d)[2])[cbVal_dep==1]
CV.input.list=(1:dim(d)[2])[cbVal_indi==1]
comparison.CV.list=(1:dim(d)[2])[cbVal==1]
print(dep.var)
print(CV.input.list)
print(comparison.CV.list)
print(tree.comparison(dep.var,CV.input.list,comparison.CV.list,d))
}
ind.OnOk <<- 1
}
OK.but <-
tkbutton(tt,text="OK",command=OnOK)
tkgrid(OK.but)
tkfocus(tt)
################################
# 2. choose
variables for individual variables
################################
# 2.1 create
individual variable list
# Use the same
variable list for the selection of comparison variables.
CV.list<-CV.list_dep
CV.name.list<-CV.name.list_dep
################################
# 2.2 create
individual variables module
# same as the
comments for dependent variable selection.
tt_indi <-
tktoplevel()
tkwm.title(tt_indi,"Individual
variable")
cb_indi<-list()
for (i in
1:length(CV.list))
{
checkbox_indi <-
tkcheckbutton(tt_indi)
#print(i)
cb_indi[[i]] <- checkbox_indi
}
cbValue_indi
<- list()
for (i in
1:length(CV.list))
{
cbValue_indi[[i]] <-
tclVar("0")
}
for (i in
1:length(CV.list))
{
#print(i)
tkconfigure(cb_indi[[i]],variable=cbValue_indi[[i]])
}
tkgrid(tklabel(tt_indi,text="Please
choose the individual variables you want to include:"))
for (i in
1:length(CV.list))
{
#print(i)
tkgrid(tklabel(tt_indi,text=CV.name.list[i]),cb_indi[[i]])
}
ind.OnOk_indi
<- 0
OnOK_indi <-
function()
{
cbVal_indi <<- c()
for (i in 1:length(CV.list))
{
cbVal_indi[i]
<<- as.numeric(tclvalue(cbValue_indi[[i]]))
}
tkdestroy(tt_indi)
cbCharacter_indi <<-
CV.name.list[cbVal_indi==1]
print(cbVal_indi)
print(cbCharacter_indi)
msg_indi="Your choices for
individual variables are:"
for (i in
1:length(cbCharacter_indi))
{
msg_indi=paste(msg_indi,cbCharacter_indi[i],sep=" ")
}
tkmessageBox(message=msg_indi)
if ((ind.OnOk_dep == 0)|(ind.OnOk
== 0))
{
tkmessageBox(message="Please choose dependent and comparison
variables")
}
else
{
dep.var=(1:dim(d)[2])[cbVal_dep==1]
CV.input.list=(1:dim(d)[2])[cbVal_indi==1]
comparison.CV.list=(1:dim(d)[2])[cbVal==1]
print(dep.var)
print(CV.input.list)
print(comparison.CV.list)
print(tree.comparison(dep.var,CV.input.list,comparison.CV.list,d))
}
ind.OnOk_indi <<- 1
}
OK.but_indi <-
tkbutton(tt_indi,text="OK",command=OnOK_indi)
tkgrid(OK.but_indi)
tkfocus(tt_indi)
}
###############################################################
###############################################################
###############################################################
###############################################################
###############################################################
###############################################################
# Create a
function "tree.comparison" to be used in the analysis.
tree.comparison
<- function(dep.var,CV.input.list,comparison.CV.list,d)
{
# Assign the names for
comparison.CV.list.
names(comparison.CV.list)=names(d)[comparison.CV.list]
# Create a separate variable to
store the names of comparison variables.
comparison.CV.name.list=names(comparison.CV.list)
# Assign k with intial value of
0.
k=0
# For each pair of comparison, we
add a column in the dataset. We use
# double loops to list all
possible pairs.
for (i in
1:(length(comparison.CV.list)-1))
{
for (j in
((i+1):length(comparison.CV.list)))
{
# increase k by one for each pair.
k=k+1
# Store the column numbers of two comparison variables in a pair
col1 <-
comparison.CV.list[i]
col2 <- comparison.CV.list[j]
# Generate the indicator for this pair. It equals to -1 if the
# first variable is smaller than the second one, and 1 otherwise.
ind=ifelse(d[,col1]<d[,col2],-1,1)
# If this the first pair, then create a new dataset c. If not, then
# add a column into c.
if (k==1)
{
c=ind
c=as.data.frame(c)
}
else
{
c=cbind(c,ind)
}
#print(comparison.CV.name.list[i])
#print(comparison.CV.name.list[j])
# Assign names for these indicator. The name contains two variable names
and
# connect them with a "_"
ind.name=paste(comparison.CV.name.list[i],"_",comparison.CV.name.list[j],sep="")
names(c)[dim(c)[2]]=ind.name
}
}
# Creata a new data frame with
dependent variable, individual variables and comparison variables.
e <-
as.data.frame(cbind(d[,dep.var],d[,CV.input.list],c))
# Assign names for e.
names(e)=c(names(d)[c(dep.var,CV.input.list)],names(c))
#print(e)
# Do the tree analysis using the
tree() in R.
tree.ltr <-
tree(e[,1]~.,e[,-1])
# Return the analysis output.
return(tree.ltr)
}
##############################################
# Simulation
example
# Generate a 100
by 10 matrix with every number drawn from a standard normal distribution.
x=matrix(rnorm(10000),100,10)
# create
indicators for x.
a1=ifelse(x[,1]>x[,2],1,-1)
a2=ifelse(x[,2]>x[,3],1,-1)
a3=ifelse(x[,3]>x[,4],1,-1)
# Create
individual variables.
a4=x[,4]
a5=x[,5]
# Create Y based
on the simulated data.
y=ifelse((10*a1+5*a2+3*a3+10*a4)>0,1,0)
# Create the
whole dataset used in the function
ddd=cbind(y,x)
# Convert the
dataset to data frame.
ddd=as.data.frame(ddd)
# Assign names
for all the columns in ddd.
names(ddd)=c("y","x1","x2","x3","x4","x5","x6","x7","x8","x9","x10")
# Do the tree
analysis.
tree.revised(ddd)
3.2. Uncommented (download here)
rm(list=ls())
tree.revised<-function(d)
{
library(tree)
require(tcltk)
###############################
# dependent
variable
################################
# 0. choose
dependent variable
################################
# 0.1 create
dependent variable list
CV.list_dep <-
c()
CV.name.list_dep
<- c()
for (i in
seq(1,dim(d)[2]))
{
CV.list_dep<-c(CV.list_dep,i)
CV.name.list_dep<-c(CV.name.list_dep,names(d)[i])
}
names(CV.list_dep)<-CV.name.list_dep
################################
# 0.2 create
choosing dependent variable module
tt_dep <-
tktoplevel()
tkwm.title(tt_dep,"Dependent
variable")
cb_dep<-list()
for (i in
1:length(CV.list_dep))
{
checkbox_dep <-
tkcheckbutton(tt_dep)
#print(i)
cb_dep[[i]] <- checkbox_dep
}
cbValue_dep <-
list()
for (i in
1:length(CV.list_dep))
{
cbValue_dep[[i]] <-
tclVar("0")
}
for (i in
1:length(CV.list_dep))
{
#print(i)
tkconfigure(cb_dep[[i]],variable=cbValue_dep[[i]])
}
tkgrid(tklabel(tt_dep,text="Please
choose the dependent variable:"))
for (i in
1:length(CV.list_dep))
{
#print(i)
tkgrid(tklabel(tt_dep,text=CV.name.list_dep[i]),cb_dep[[i]])
}
ind.OnOk_dep
<- 0
OnOK_dep <-
function()
{
cbVal_dep <<- c()
for (i in 1:length(CV.list_dep))
{
cbVal_dep[i]
<<- as.numeric(tclvalue(cbValue_dep[[i]]))
}
tkdestroy(tt_dep)
cbCharacter_dep <<-
CV.name.list_dep[cbVal_dep==1]
print(cbVal_dep)
print(cbCharacter_dep)
msg_dep="Your choices for dependent variable is:"
for (i in
1:length(cbCharacter_dep))
{
msg_dep=paste(msg_dep,cbCharacter_dep[i],sep=" ")
}
tkmessageBox(message=msg_dep)
if ((ind.OnOk ==
0)|(ind.OnOk_indi == 0))
{
tkmessageBox(message="Please
choose comparison and individual variables")
}
else
{
dep.var=(1:dim(d)[2])[cbVal_dep==1]
CV.input.list=(1:dim(d)[2])[cbVal_indi==1]
comparison.CV.list=(1:dim(d)[2])[cbVal==1]
print(dep.var)
print(CV.input.list)
print(comparison.CV.list)
print(tree.comparison(dep.var,CV.input.list,comparison.CV.list,d))
}
ind.OnOk_dep <<- 1
}
OK.but_dep <-
tkbutton(tt_dep,text="OK",command=OnOK_dep)
tkgrid(OK.but_dep)
tkfocus(tt_dep)
################################
# 1. choose
variables to create comparison indicators
################################
# 1.1 create
comparison variable list
CV.list<-CV.list_dep
CV.name.list<-CV.name.list_dep
################################
# 1.2 create
choosing variables module
tt <-
tktoplevel()
tkwm.title(tt,"Comparison
variable")
cb<-list()
for (i in
1:length(CV.list))
{
checkbox <-
tkcheckbutton(tt)
#print(i)
cb[[i]] <- checkbox
}
cbValue <-
list()
for (i in
1:length(CV.list))
{
cbValue[[i]] <-
tclVar("0")
}
for (i in
1:length(CV.list))
{
#print(i)
tkconfigure(cb[[i]],variable=cbValue[[i]])
}
tkgrid(tklabel(tt,text="Please
choose the variables you want to compare:"))
for (i in
1:length(CV.list))
{
#print(i)
tkgrid(tklabel(tt,text=CV.name.list[i]),cb[[i]])
}
ind.OnOk <- 0
OnOK <-
function()
{
cbVal <<- c()
for (i in 1:length(CV.list))
{
cbVal[i]
<<- as.numeric(tclvalue(cbValue[[i]]))
}
tkdestroy(tt)
cbCharacter <<-
CV.name.list[cbVal==1]
print(cbVal)
print(cbCharacter)
msg="Your choices for
comparison variables are:"
for (i in 1:length(cbCharacter))
{
msg=paste(msg,cbCharacter[i],sep=" ")
}
tkmessageBox(message=msg)
if ((ind.OnOk_dep ==
0)|(ind.OnOk_indi == 0))
{
tkmessageBox(message="Please
choose dependent and individual variables")
}
else
{
dep.var=(1:dim(d)[2])[cbVal_dep==1]
CV.input.list=(1:dim(d)[2])[cbVal_indi==1]
comparison.CV.list=(1:dim(d)[2])[cbVal==1]
print(dep.var)
print(CV.input.list)
print(comparison.CV.list)
print(tree.comparison(dep.var,CV.input.list,comparison.CV.list,d))
}
ind.OnOk <<- 1
}
OK.but <-
tkbutton(tt,text="OK",command=OnOK)
tkgrid(OK.but)
tkfocus(tt)
################################
# 2. choose
variables for individual variables
################################
# 2.1 create
individual variable list
CV.list<-CV.list_dep
CV.name.list<-CV.name.list_dep
################################
# 2.2 create
individual variables module
tt_indi <-
tktoplevel()
tkwm.title(tt_indi,"Individual
variable")
cb_indi<-list()
for (i in
1:length(CV.list))
{
checkbox_indi <-
tkcheckbutton(tt_indi)
#print(i)
cb_indi[[i]] <- checkbox_indi
}
cbValue_indi
<- list()
for (i in
1:length(CV.list))
{
cbValue_indi[[i]] <-
tclVar("0")
}
for (i in
1:length(CV.list))
{
#print(i)
tkconfigure(cb_indi[[i]],variable=cbValue_indi[[i]])
}
tkgrid(tklabel(tt_indi,text="Please
choose the individual variables you want to include:"))
for (i in
1:length(CV.list))
{
#print(i)
tkgrid(tklabel(tt_indi,text=CV.name.list[i]),cb_indi[[i]])
}
ind.OnOk_indi
<- 0
OnOK_indi <-
function()
{
cbVal_indi <<- c()
for (i in 1:length(CV.list))
{
cbVal_indi[i]
<<- as.numeric(tclvalue(cbValue_indi[[i]]))
}
tkdestroy(tt_indi)
cbCharacter_indi <<-
CV.name.list[cbVal_indi==1]
print(cbVal_indi)
print(cbCharacter_indi)
msg_indi="Your choices for
individual variables are:"
for (i in
1:length(cbCharacter_indi))
{
msg_indi=paste(msg_indi,cbCharacter_indi[i],sep=" ")
}
tkmessageBox(message=msg_indi)
if ((ind.OnOk_dep == 0)|(ind.OnOk
== 0))
{
tkmessageBox(message="Please choose dependent and comparison
variables")
}
else
{
dep.var=(1:dim(d)[2])[cbVal_dep==1]
CV.input.list=(1:dim(d)[2])[cbVal_indi==1]
comparison.CV.list=(1:dim(d)[2])[cbVal==1]
print(dep.var)
print(CV.input.list)
print(comparison.CV.list)
print(tree.comparison(dep.var,CV.input.list,comparison.CV.list,d))
}
ind.OnOk_indi <<- 1
}
OK.but_indi <-
tkbutton(tt_indi,text="OK",command=OnOK_indi)
tkgrid(OK.but_indi)
tkfocus(tt_indi)
}
###############################################################
###############################################################
###############################################################
###############################################################
###############################################################
###############################################################
tree.comparison
<- function(dep.var,CV.input.list,comparison.CV.list,d)
{
names(comparison.CV.list)=names(d)[comparison.CV.list]
comparison.CV.name.list=names(comparison.CV.list)
k=0
for (i in
1:(length(comparison.CV.list)-1))
{
for (j in
((i+1):length(comparison.CV.list)))
{
k=k+1
col1 <- comparison.CV.list[i]
col2 <- comparison.CV.list[j]
ind=ifelse(d[,col1]<d[,col2],-1,1)
if (k==1)
{
c=ind
c=as.data.frame(c)
}
else
{
c=cbind(c,ind)
}
#print(comparison.CV.name.list[i])
#print(comparison.CV.name.list[j])
ind.name=paste(comparison.CV.name.list[i],"_",comparison.CV.name.list[j],sep="")
names(c)[dim(c)[2]]=ind.name
}
}
e <-
as.data.frame(cbind(d[,dep.var],d[,CV.input.list],c))
names(e)=c(names(d)[c(dep.var,CV.input.list)],names(c))
#print(e)
tree.ltr <-
tree(e[,1]~.,e[,-1])
return(tree.ltr)
}
x=matrix(rnorm(10000),100,10)
a1=ifelse(x[,1]>x[,2],1,-1)
a2=ifelse(x[,2]>x[,3],1,-1)
a3=ifelse(x[,3]>x[,4],1,-1)
a4=x[,4]
a5=x[,5]
y=ifelse((10*a1+5*a2+3*a3+10*a4)>0,1,0)
ddd=cbind(y,x)
ddd=as.data.frame(ddd)
names(ddd)=c("y","x1","x2","x3","x4","x5","x6","x7","x8","x9","x10")
tree.revised(ddd)
#data(cpus,
package="MASS")
#tree.revised(cpus)
#tree.revised(iris)
http://www.statsoft.com/textbook/stclatre.html
www.wikipedia.org